

Someone who is online every day doesn’t read on paper, right? Little by little, books, newspapers and magazines will all disappear… Not so long ago there was plenty of debate about whether such a trend really existed. At the start of the 21st century, “Will the mouse eat the book?” became a favorite cliché for describing the phenomenon. The “catchphrase” was born in 2001 as the essay topic of the written university entrance exam in journalism at Sofia University “St. Kliment Ohridski.”
Yes, it is a fact that the digital present is forever changing the way we read and take in information. And yet, to what extent has the internet swallowed us? Have we really stopped reading books? Have newspapers turned out to be unnecessary? We turn to the official data on the portal of the National Statistical Institute to look for patterns and interesting trends.
Paper letters or digital ones—which won? Did they even go to battle?

Of Mice and Threads
Let us head into the strict world of figures. We examine the data available from the free public portal of the National Statistical Institute, covering the last two decades. For the analysis we use Jupyter Notebook and scripts written in Python. (You’ll find the technical side of the processing here.)
The NSI portal lets you download quite a variety of data with different parameters. Still, the data are not always perfect: in places, substantial samples are missing, and little is known about the specific methods used to generate a given statistic.
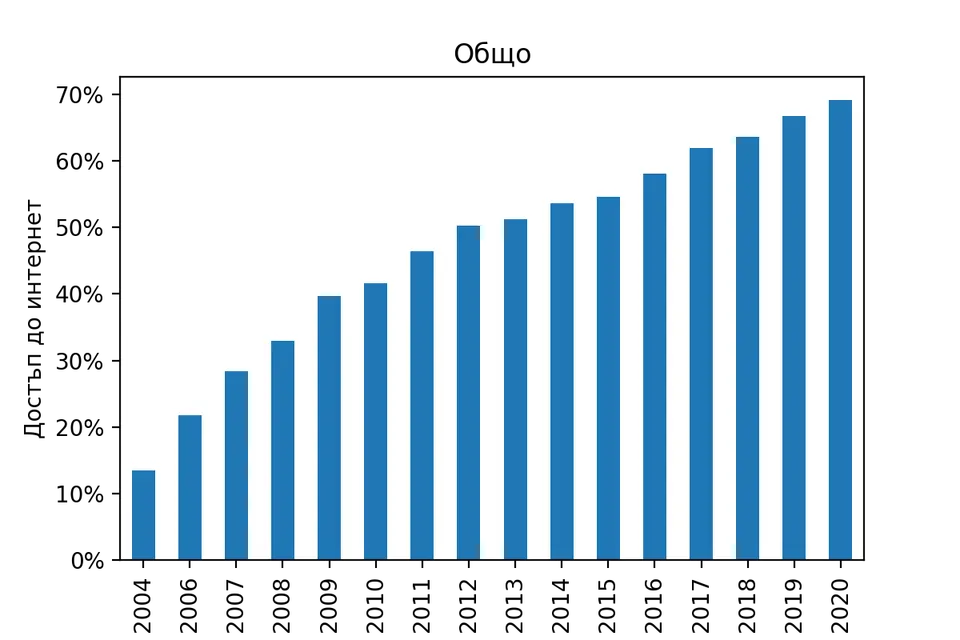
The first table, and the key one for our purposes, tracks trends in internet access overall and among individual groups, based on various demographic characteristics. To be precise, it measures the change over the years in the percentage of people who use the internet every day or at least once a week.
A Mouse on the Rise
Pretty clear bars. Over recent years, the percentage of people who go online at least once a week has grown slowly but without exception. The increase over 16 years is truly huge. (Unfortunately, we lack good enough statistics on how the average time spent online has changed, which would be rather interesting.)
What do things look like if we look at the individual regions?
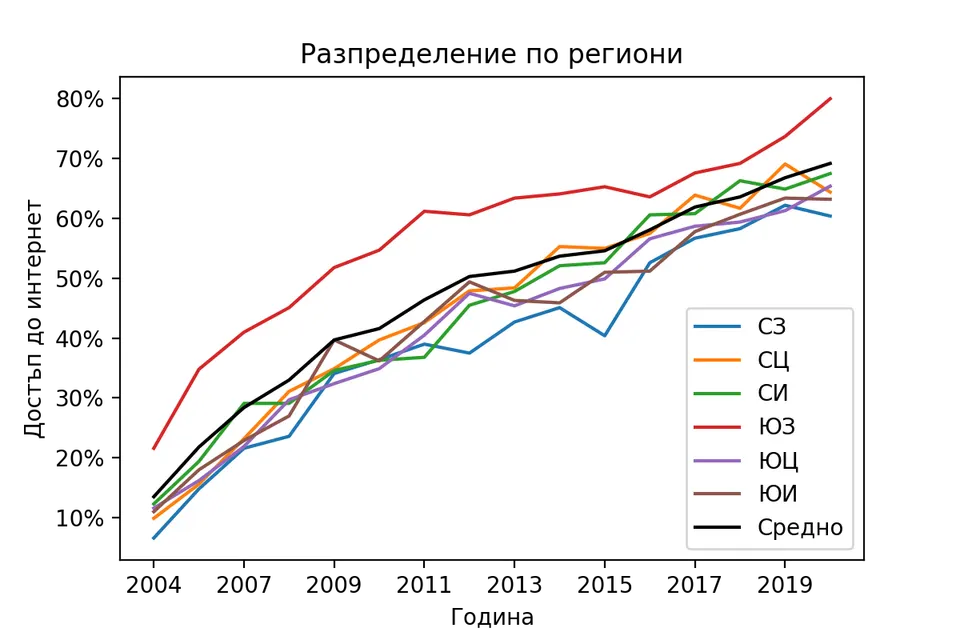
In black you see the averages, above which the red line clearly rises. That is Southwestern Bulgaria, where the statistics include Sofia. Nothing surprising; the only surprise may be how much this region stands out. The average age of the population, which is considerably lower in the capital, surely has something to do with it.
At the other pole, in blue and just as unsurprisingly, stands the Northwestern region.
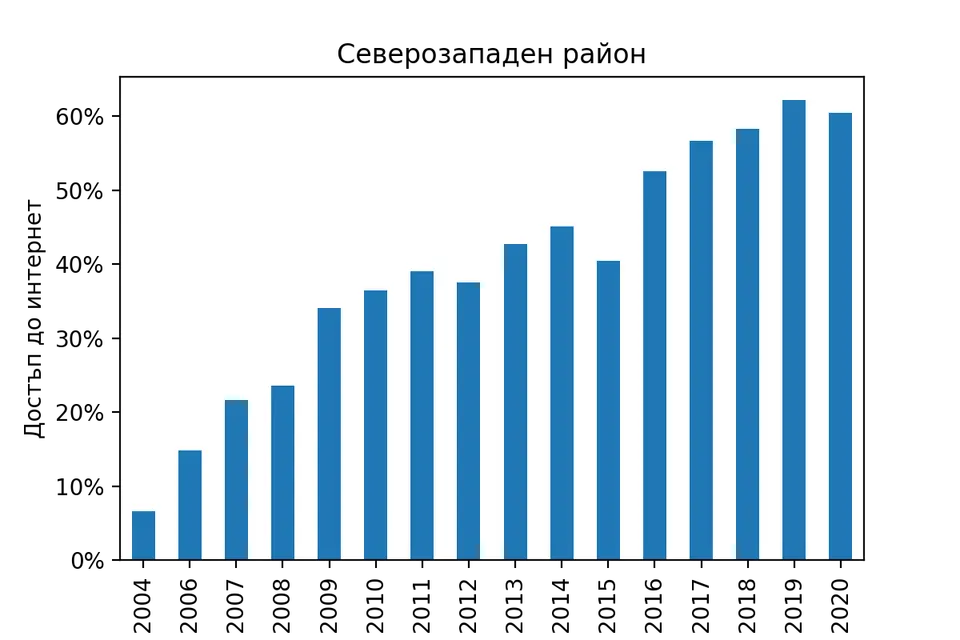
If we isolate “the poorest region in the European Union,” as another cliché goes, the statistics broadly follow the general trend, albeit with a few anomalies. The drops in 2012 and 2015 are hard to explain. The third drop, in 2020, is even stranger, since we have all grown used to believing that in the first coronavirus year people flocked online en masse—and also went back to their hometowns. So why does the number of people with internet access in Northwestern Bulgaria fall?
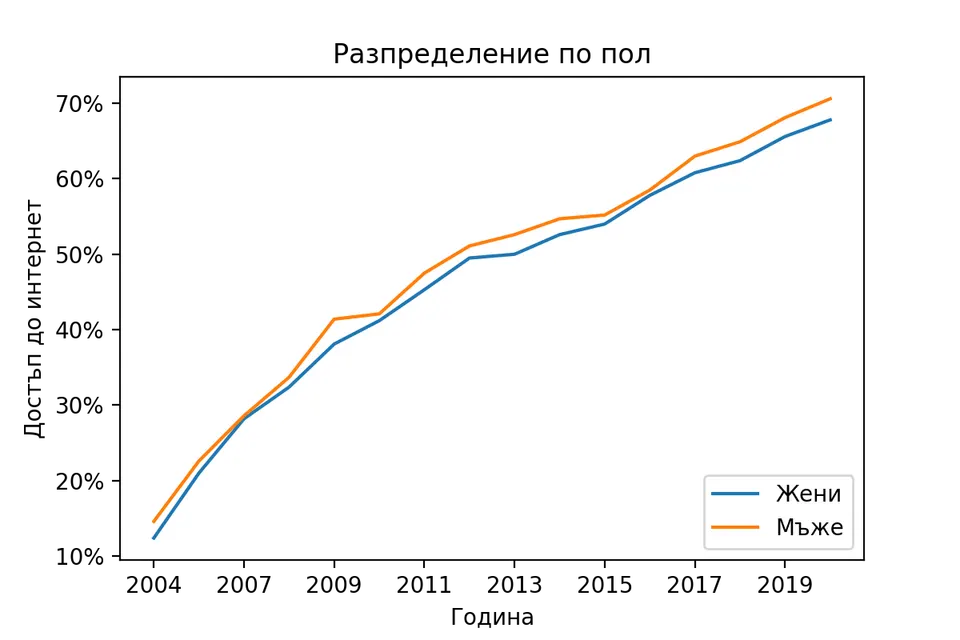
Trends in internet access hardly change with gender. Men are ahead, but only marginally, in every single year.
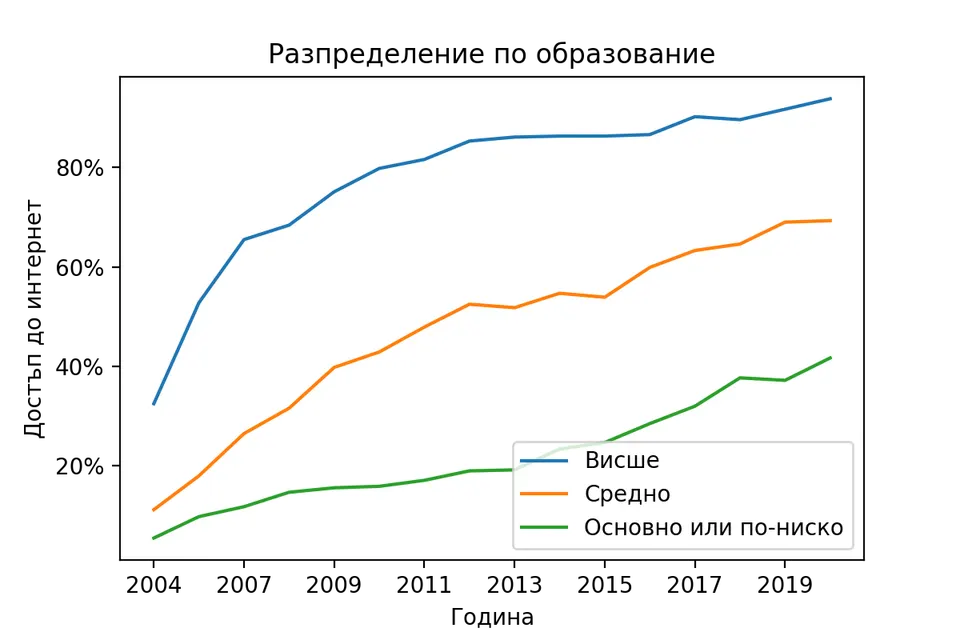
A Book for Every Mouse!
This brings us to the first comparison in which there is serious divergence between the groups. Especially in the first years of the millennium, the percentage of university graduates with daily internet access grows dramatically. After that, growth among the three groups, divided by level of education, stays similar; the gap is more of a starting one.
It is also worth noting the increase among the least educated over the past two years, probably linked to the changes imposed by the pandemic.
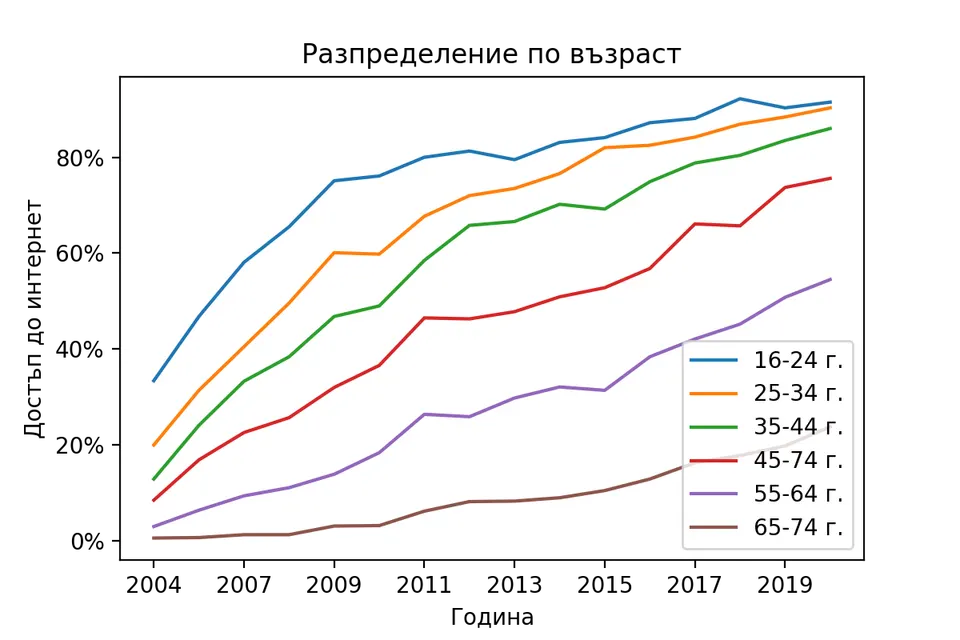
Quite as expected, the differences by age are substantial.
In the first years of the new century there is very strong growth in the number of people who use the internet daily, and the younger the group, the more dramatic it is. After that, the trends hold steady. The slower growth in the oldest group covered by the statistics stands out. Nor should we overlook the fact that the span of the data (16 years) includes a change of generations. Someone who was 24 in 2004 is already 40 in 2020.
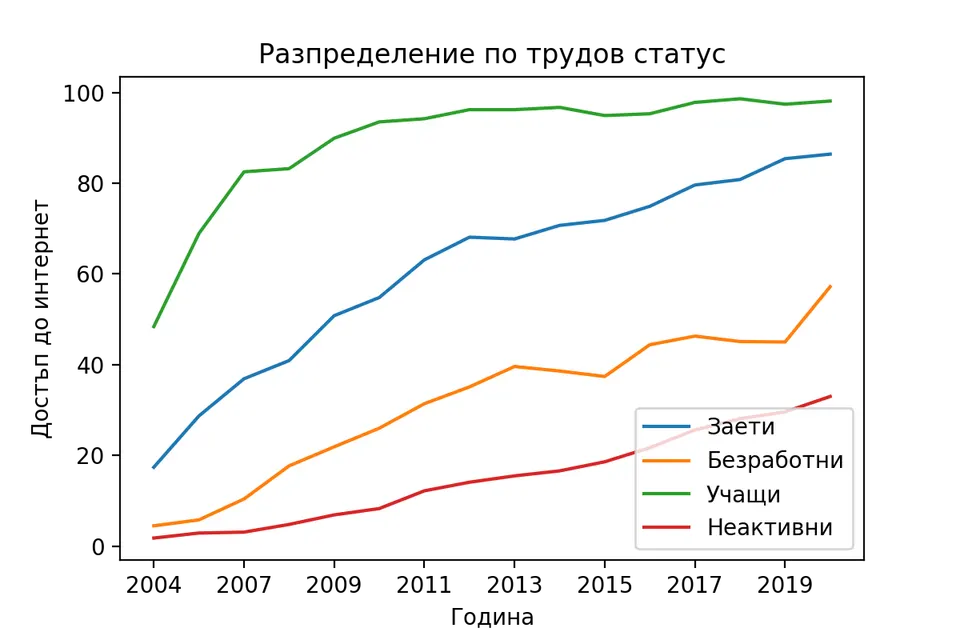
It is hardly surprising that the percentage of people online is much higher among the young and those in education, and drastically lower among the older and the unemployed. The digital world is closely tied to inequality, and we will soon devote a special piece in Digital Stories to the subject.
Among students, the percentage grows dramatically in the early years of the period, which is also connected to generational trends. Among the employed there is strong growth in the first years and more gradual growth after that. The fluctuations among the unemployed are interesting, especially in the last year. On the one hand, they may be due to the fact that many people landed in this group from sectors hit hard by the pandemic. Others may have become convinced that the online world offers more opportunities for professional growth.
Mouse by Mouse, a Book
Let us see how the trends in print publications changed over the same period. First we look at the total circulation of newspapers published.
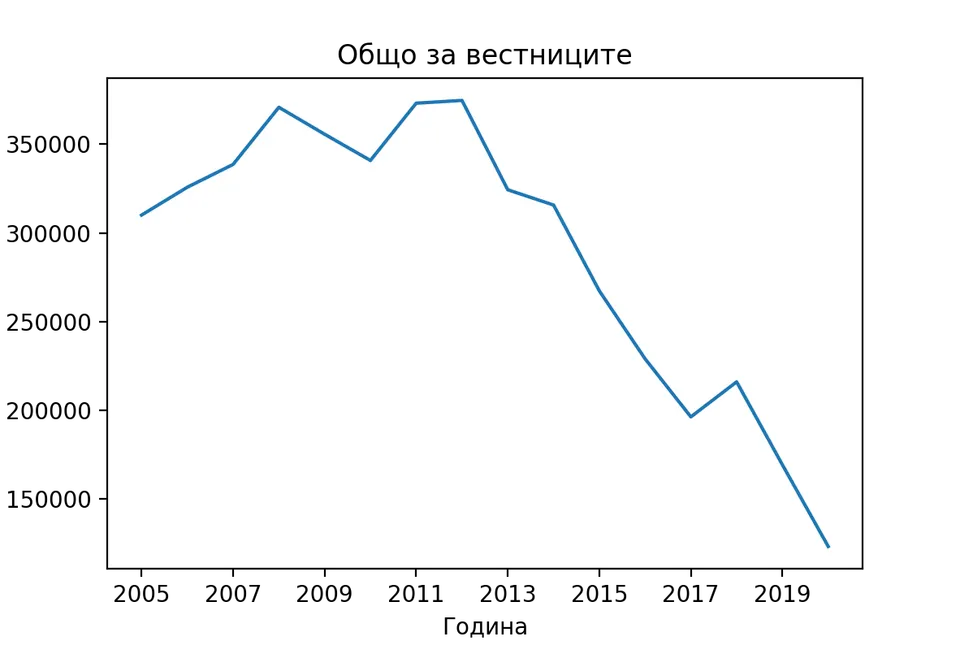
This chart needs little commentary. After 2012, circulation collapses drastically and unambiguously.
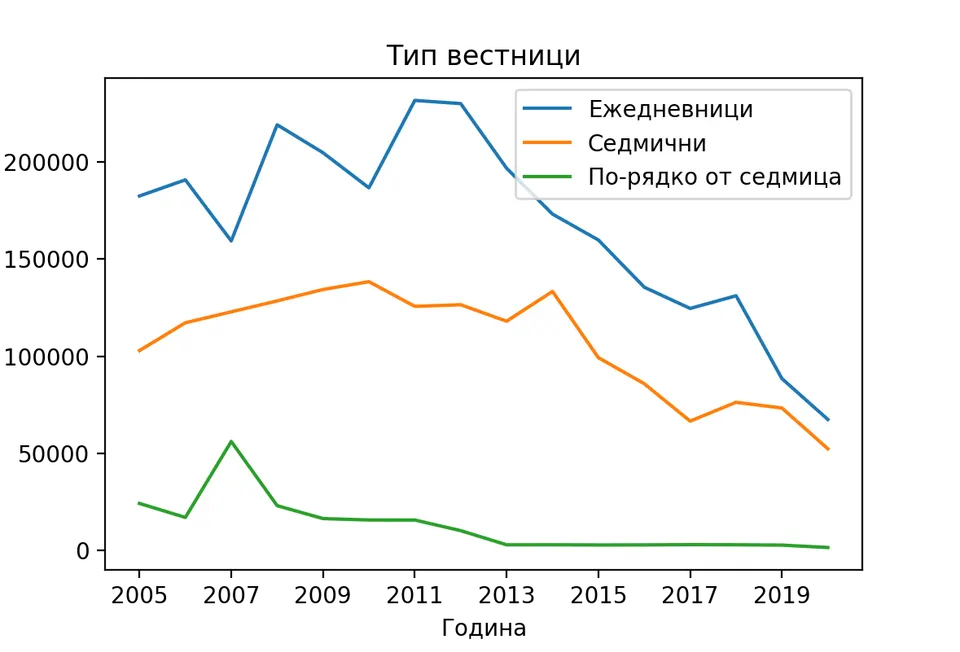
Clearly this covers all publications, regardless of how often they come out. Dailies, which are also the most popular, decline fastest after 2011, but the trend is obviously general.
Let us check how things stand in terms of the number of titles—how many different newspapers come out each year.
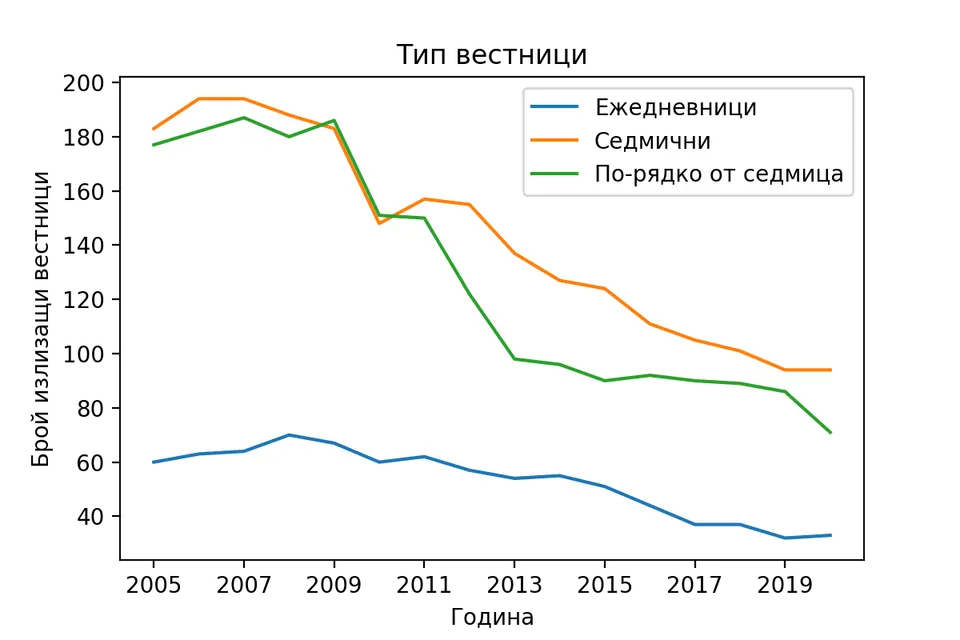
The trend is obvious here too.
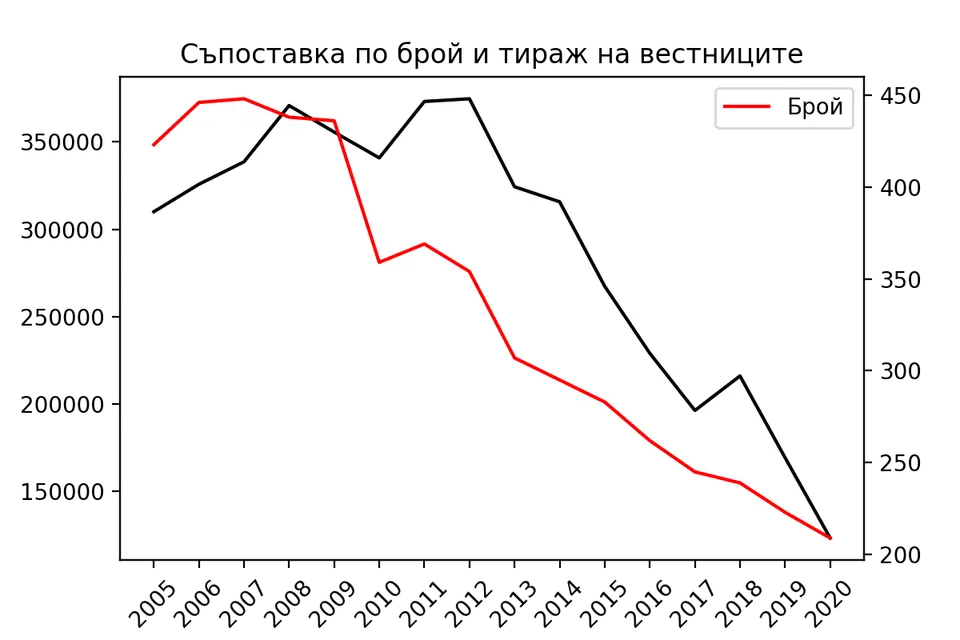
We overlay the two trends—newspaper circulation and the number of newspapers—and see quite clearly which way the arrow points.
And what about magazines? They are a different type of media; will the decline be just as dramatic?
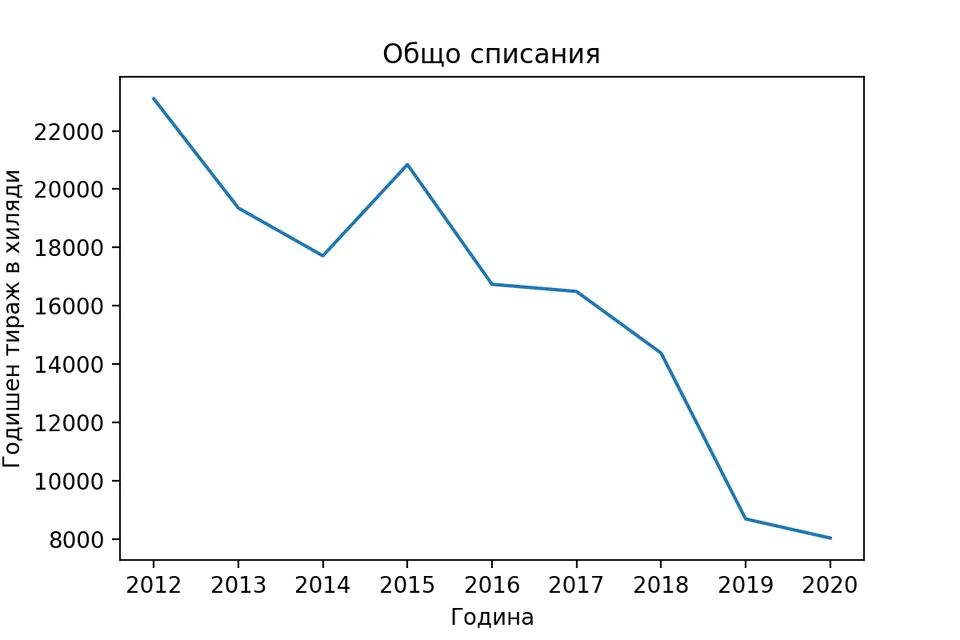
After an interesting rise in 2015 (which probably has some explanation that escapes me), here too we see a fast and dramatic decline.
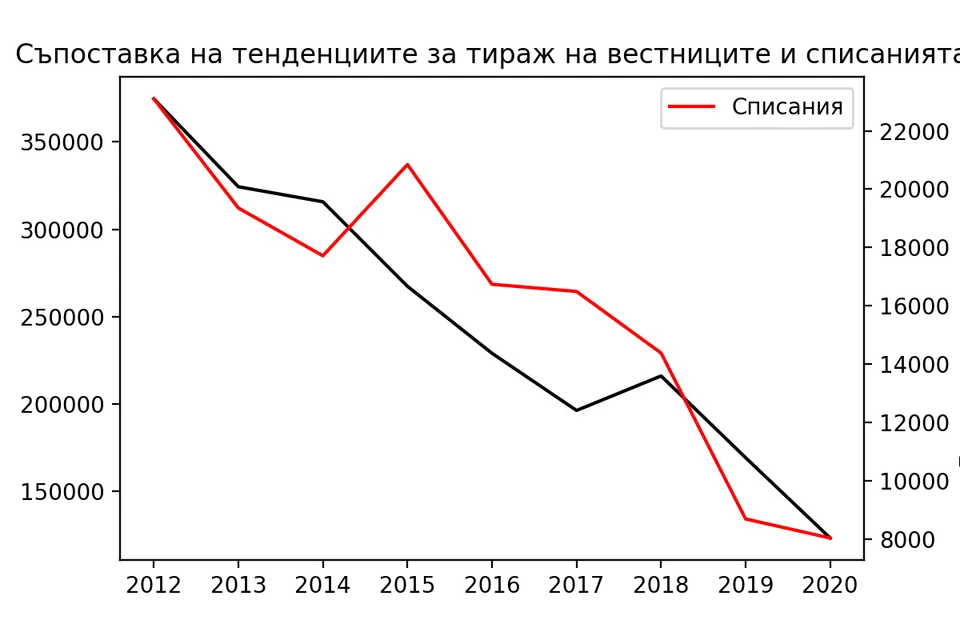
The trends for the two main types of print media are entirely alike.
So… will the same hold true for books?
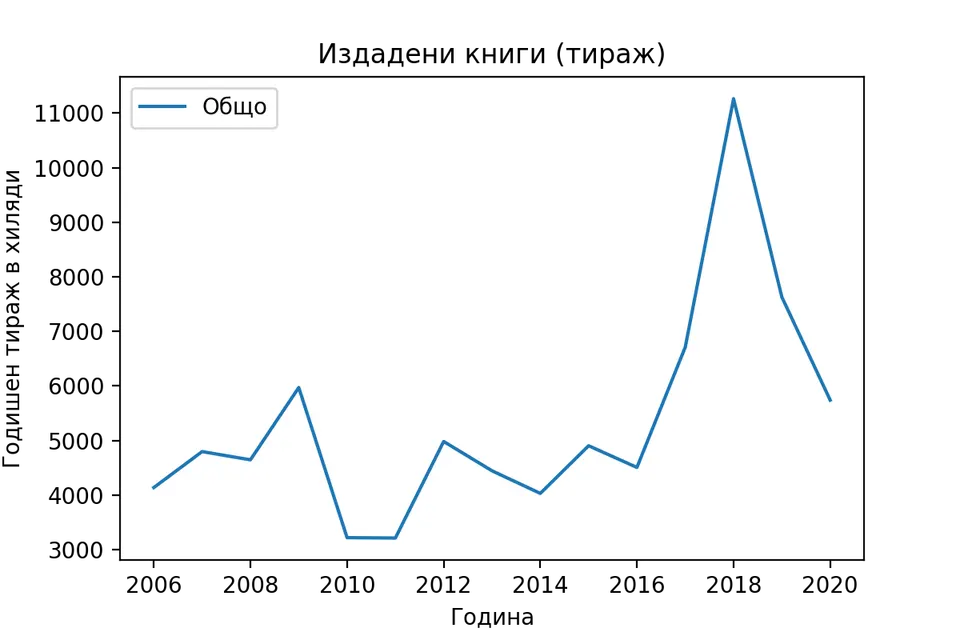
A Book with a Trim
The situation is visibly different from that of periodicals. 2018 is an interesting peak, and the trend is clear. Then comes an understandable dip over the last two years, in which, however, the circulation of published books still stays higher than it was 15 years ago!
Evidently, book publishing has not only held its ground but grown!
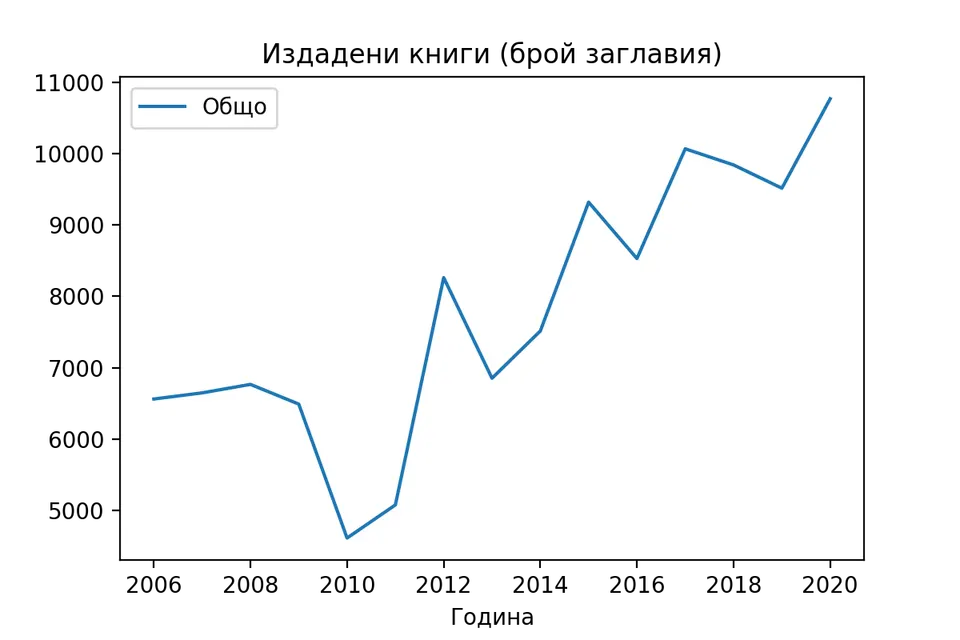
And if we look at the number of books published, the growth is even more substantial and doesn’t stop even with the pandemic. Anyone who wants to, publishes… And apparently there are people to read them, too.
What does the data look like if we compare the trends for newspapers and books by circulation (in thousands of copies)?
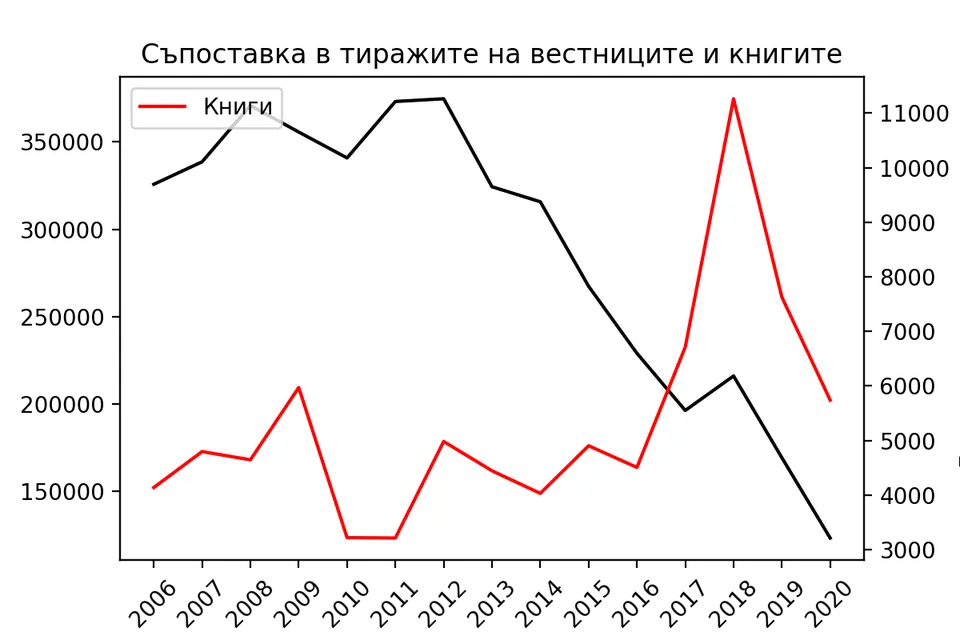
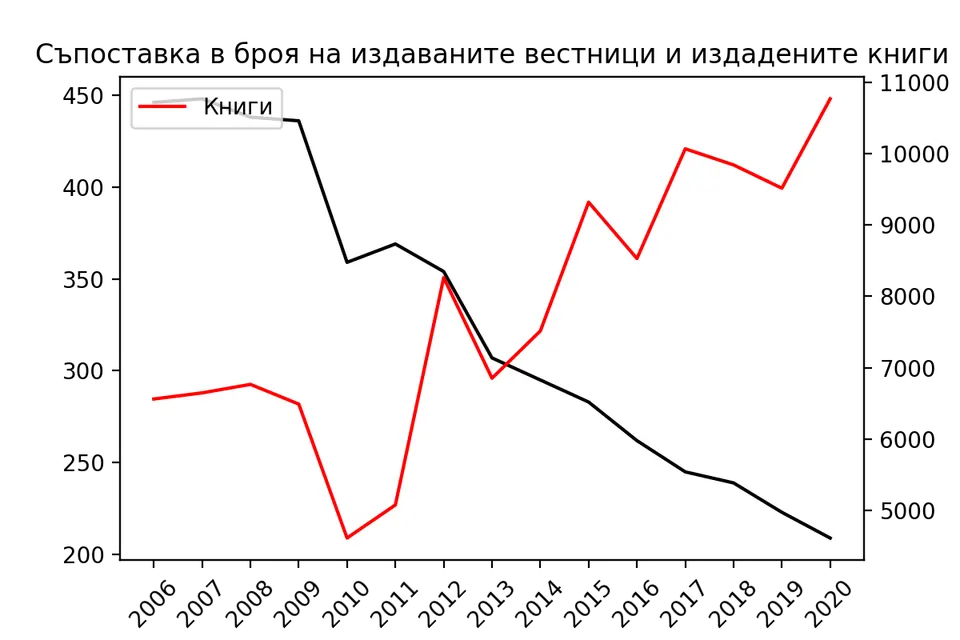
And so we see the encouraging red line and the much sadder (for people who love print media) black one.
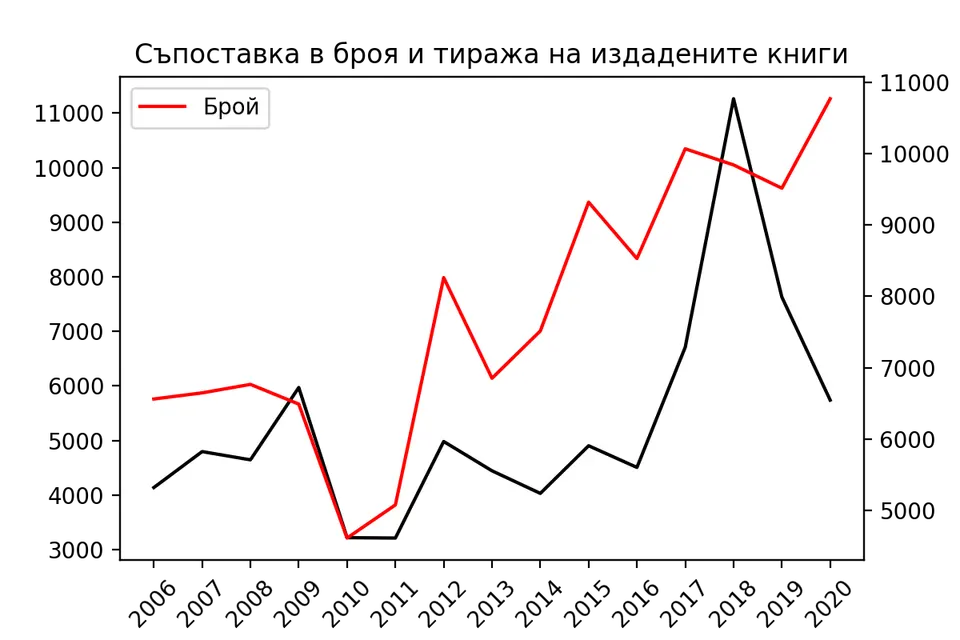
So it is now clear: more and more Bulgarians have internet access. The circulation of periodicals has collapsed over this period. What could the reason be? Is there any way to prove a link between the two trends?
I download quite a few tables from the NSI; the closest in subject turns out to be the one on the reasons for using the internet for personal purposes. It contains over 30 indicators, but nobody thought to add one for the internet as a source of information. What’s more, for many of the years the information is missing or incomplete.

A Carefree Mouse
So we are left to trust our intuition that online media really are what caused the sharp decline in print publications.
No, the mouse did not eat the book; the two evidently have different fields to play on. The newspaper and the magazine, however, have (by all appearances irreversibly) fallen victim to digitalization.
The book comes out of this battle safe, sound and thriving. May it stay that way…